Location: Na+/H+ Exchanger @ ec47b51fda2c / documentation-fig3b.html
- Author:
- Soroush Safaei <ssaf006@aucklanduni.ac.nz>
- Date:
- 2016-05-06 15:21:46+12:00
- Desc:
- Modifying the documentation
- Permanent Source URI:
- https://staging.physiomeproject.org/workspace/28f/rawfile/ec47b51fda2c33afe8535b56355e1b9c44dedf1f/documentation-fig3b.html
Figure 3B
This is the general mathematical model for the NHE3 model with modifications to enable simulations which are capable of reproducing Figure 3B in the original paper. The simulation experiment for this model can be obtained by loading the corresponding SED-ML document into OpenCOR and executing the simulation. The results of which are shown below. A rendering of the mathematical model itself is available here.
In Figure 3, the zero trans Na+ flux (relative to maximal zero trans flux) is computed as a function of external Na+ concentration at two values of external pH, 6.6 (3A) or 7.5 (3B). Internal pH 6.0 and internal Na+ = 0.0 mmol/litre, NH4+ is absent. Data are graphed as a Hanes-Woolf plot.
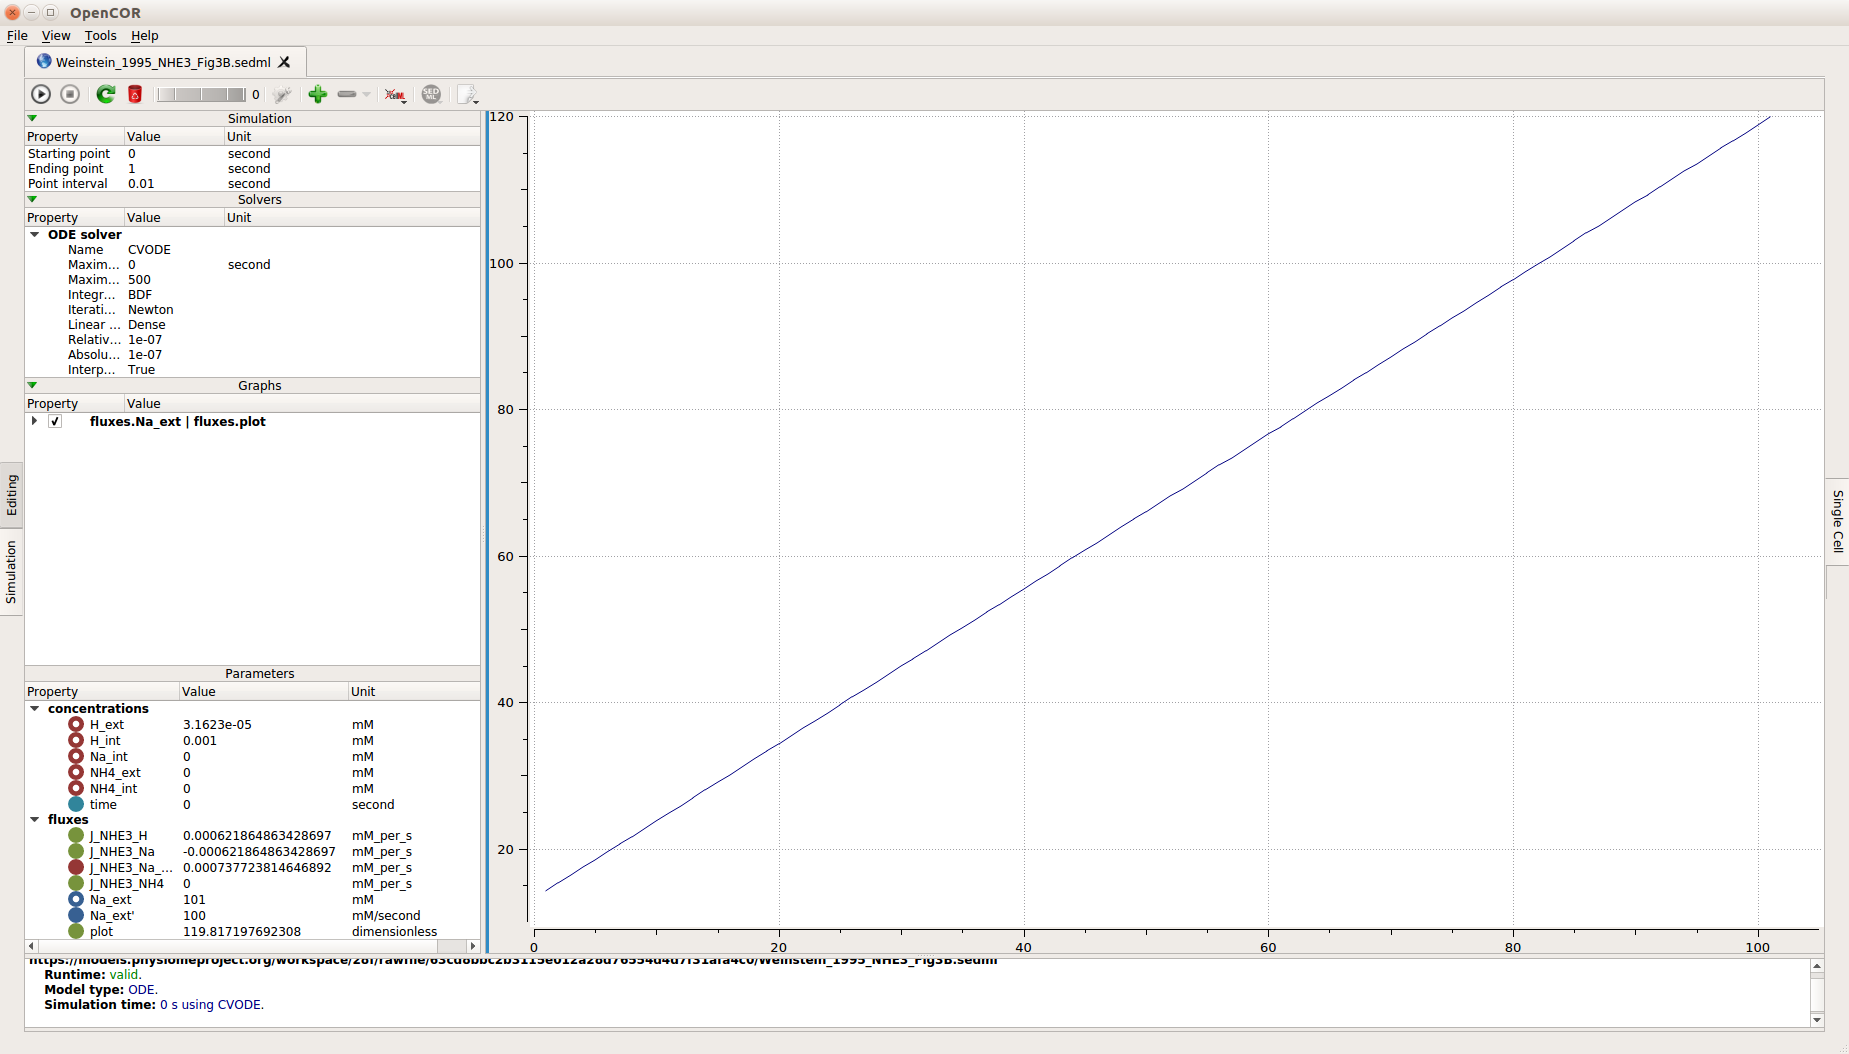
A screenshot illustrating the results when the associated SED-ML document is loaded into OpenCOR and the simulation executed.
This can be reproduced directly from the repository by choosing the Launch with OpenCOR link from the Views Available.